Buying
Allocation aware of the network.

Aurélien

The retailer
A 14-store premium contemporary retailer with a 2017 allocation rule and a brand-new allocation lead.
Our retailer operates 14 stores across France in the lifestyle apparel premium contemporary segment. The team is structured: a 3-person buying team plus a dedicated merchandising lead, running roughly 5,500 SKUs in season across stores, e-commerce, and a small e-com extension.
The stack is mainstream for the sector — Polaris as core retail management, Shopify for e-commerce, and Excel as the connective tissue between everything else. It works. Until it doesn't.
"We allocated the same way for ten years. Every year, the same stores ran out and the same stores got stuck."
— Allocation Lead
Context
A 14-store network with very different stores treated the same way.
FW 2024. The retailer's network ranged from a flagship in Paris to small stores in regional towns. Same buy, same allocation rules, since the company was 8 stores. The team knew it didn't work — but rebuilding it meant questioning every assumption.
The new allocation lead, three months in, ran the numbers. Tier-A stores ran out of bestsellers by week 4. Tier-C stores still had week-1 stock at week 12. The pattern repeated every season. The total revenue was OK; the missed opportunities were huge.
The network had grown. The allocation logic hadn't.
The Problematic
Allocation was a copy-paste job, not a decision.
When the season arrived at the warehouse, the allocation team split it across stores using a rule that had been written in 2017: each store got a quota proportional to its previous-year revenue, with a few manual adjustments for known bestsellers.
The rule ignored everything that had changed since: store size, customer profile, online cannibalization, local events. The team knew the rule was wrong. They didn't have the data to fight it.
Three problems compounded:
Same allocation logic for very different store profiles (flagship vs regional).
No store-level sell-through data to challenge the rule.
Two weeks of fire-fighting with inter-store transfers, every season.
The team was allocating based on yesterday's network for tomorrow's season. Yesterday won.
The Solution
Per-store, per-tier allocation, computed on real demand.
Solya analyzed three years of sell-through per store, per category, per week. It tagged every store on three dimensions: revenue tier, customer profile, seasonality strength. The allocation logic became a function of these tags, not of last year's revenue alone.
For the FW 2024 season, Solya proposed a new allocation: more stock to flagship and high-velocity stores, less to slow regional ones, with a 12% reserve held back for week-3 rebalancing. The team reviewed, adjusted on a few items, and shipped.
Per-store tagging on three dimensions, dynamic over time.
Per-SKU optimal distribution respecting MOQs, capacity, reserve policy.
12% reserve held back for early-season rebalancing.
First time the allocation matched the network it served.
How we did it
Inside the loop.
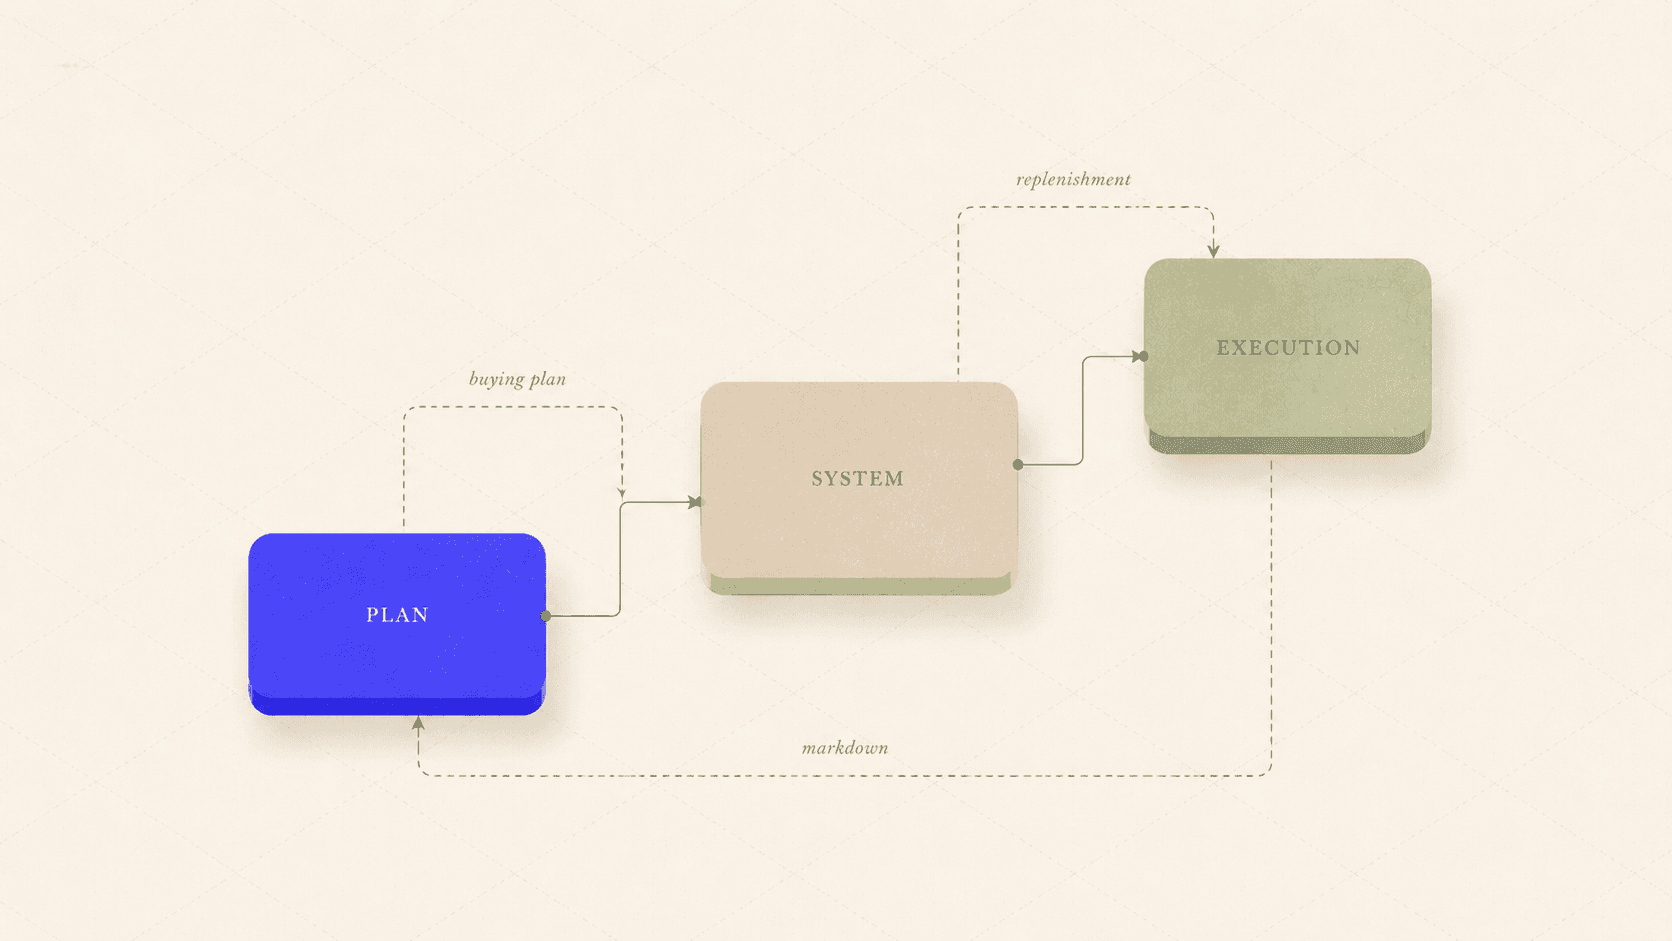
The new allocation ran on the four Solya layers, with the allocation team in the loop on every category. Here's how the system works, end to end.
01 — Ingest store-level history.
Solya pulled three years of sell-through from Polaris, broken down by store, category, and week. Patterns surfaced that had never been visible at the aggregated level.
02 — Tag every store.
Each store was tagged on three dimensions: revenue tier, customer profile (seasonal vs steady), and category strength. Tags were dynamic — they updated as new data came in.
03 — Compute optimal distribution.
For each SKU and category, Solya calculated the ideal allocation across stores, respecting MOQs, store capacity, and the team's reserve policy.
04 — Recommend with reserve.
Solya proposed a per-store allocation, plus a 12% reserve held back for early-season rebalancing based on the first weeks of sell-through.
05 — Ship and learn.
The allocation went live the day stock landed. Sell-through was monitored from week 1. Solya logged what worked, what didn't, and adjusted the model for the next season.
The allocation became a decision. Not a copy-paste.
The Impacts
A network that finally got what it actually needed.
After the first season running on the Solya allocation, tier-A stores stopped running out of bestsellers, tier-C stores stopped sitting on dead stock, and the team stopped chasing transfers.
+9 pts — Full-price sell-through in tier-A stores.
−15% — Inter-store transfers needed in season.
12% — Reserve held back for live rebalancing.
Day 1 — Live allocation the day stock landed.
"For the first time, the network felt designed, not assembled."
— Allocation Lead
Explore more use cases
One platform. Every retail decision.
Inventory, allocation, pricing, planning, execution — connected in a single operational layer.