Markdown
End-of-season, in one view.

Aurélien

The retailer
A 10-store casual apparel retailer, two buyers, four thousand five hundred SKUs.
Our retailer operates 10 stores across France in the casual apparel and athleisure segment. The team is lean: a 2-person buying team and a 1-person operations manager, running roughly 4,500 SKUs in season.
The stack is mainstream for the sector — Fastmag as the system of record, Shopify for e-commerce, and Excel as the connective tissue between everything else. It works. Until it doesn't.
"End-of-season was four spreadsheets, three teams, and zero visibility on what was actually happening."
— Operations Manager
Context
End-of-season was the messiest moment of the year.
Late SS 2024. The retailer was three weeks from end-of-season, and the operations manager couldn't get a clear answer to a simple question: how much residual stock are we ending with, and where is it?
Returns were flowing back from stores. Inter-store transfers were happening informally. Markdown waves had been launched but the impact wasn't clear. Four teams were working on four Excels, and nothing was talking to anything else.
The data existed everywhere. The picture existed nowhere.
The Problematic
Four operations, four spreadsheets, zero coherence.
End-of-season operations involved four parallel flows: incoming returns from stores, inter-store transfers driven by store managers, residual stock tracking from the warehouse, and markdown impact monitoring from the buying team. Each flow had its own spreadsheet, its own owner, its own update cadence.
The operations manager spent her last three weeks of the season manually consolidating these flows into a master tracker. Half the time, the numbers didn't reconcile. The other half, they were already stale by the time she presented them.
Three symptoms made it worse:
Returns, transfers, residuals, markdowns each tracked in a separate Excel.
No single number anyone could trust on remaining residual stock.
Critical decisions made on numbers that were already two weeks old.
End-of-season was a coordination problem disguised as a data problem.
The Solution
One live view of everything ending the season.
Solya consolidates returns from Fastmag, transfers from store managers, residual stock from the warehouse, and markdown impact from the POS — into one live dashboard. The operations manager sees, in real time, what's coming back, where it's going, what's still in stores, and how markdown is performing.
When something needs attention — a transfer pending too long, a markdown not converting, residual stock building up — Solya flags it. The operations manager doesn't chase information anymore. She acts on signals.
One live model consolidates four parallel flows into shared truth.
Real-time status by SKU, store, flow type, and date.
Alerts on exceptions — pending transfers, slow markdown, residual building up.
End-of-season turned from chaos into a closeable phase.
How we did it
Inside the loop.
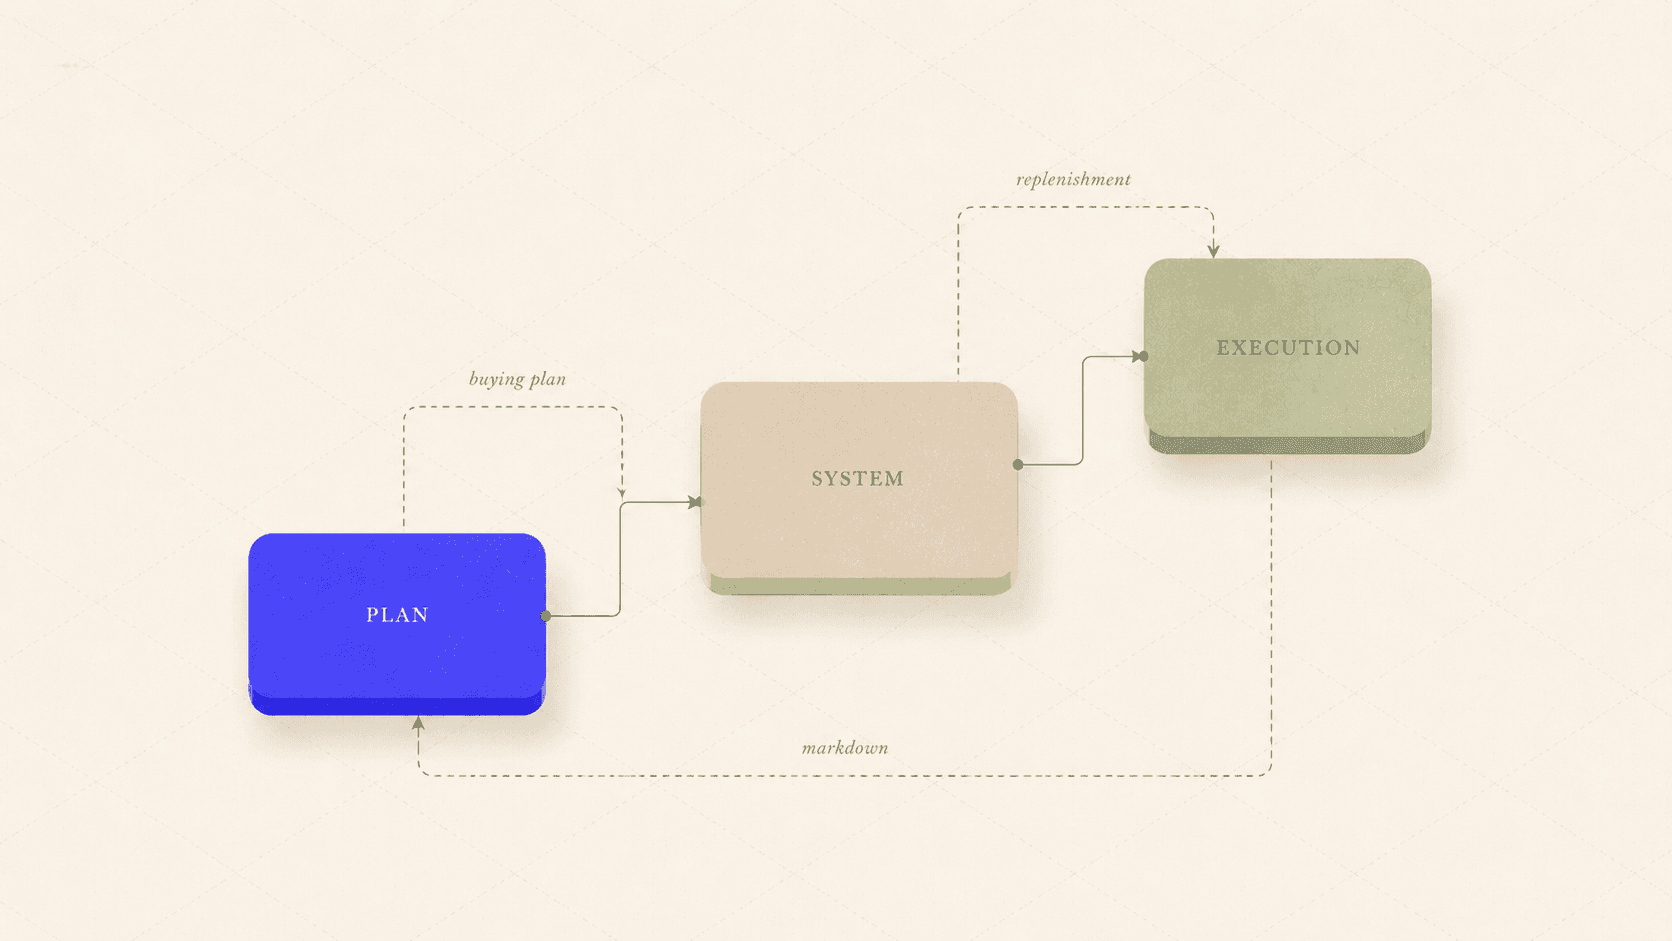
The end-of-season view runs on three Solya layers, consolidating four parallel flows into one shared truth. Here's how the system works, end to end.
01 — Connect every flow.
Solya ingested returns from Fastmag, transfer orders from the warehouse system, residual stock counts from POS, and markdown applications from the buying tool. No flow left behind.
02 — Reconcile in one model.
Every record was tagged by SKU, store, flow type, and date. The model showed, for any moment in time, the full state of stock across the network.
03 — Compute live status.
The operations manager saw, in real time: returns received vs returns expected, transfers completed vs transfers pending, residual stock by store, markdown effectiveness by category.
04 — Flag what needs attention.
Pending transfers older than 5 days. Residual stock above target. Markdown lines not converting. — Solya raised signals before they became problems.
05 — Close the season cleanly.
By end-of-season, every flow was reconciled, every number was traceable, and the team could move into the next season with a clean baseline.
End-of-season stopped being a coordination war. It became a closing exercise.
The Impacts
A messy phase turned into a clean closing.
After running two end-of-seasons on Solya, the operations manager stopped chasing numbers across spreadsheets and started managing exceptions instead.
1 view — For returns, transfers, residuals, and markdown.
−40% — Time spent on end-of-season operations.
Real-time — Visibility on every flow.
Zero — Reconciliation meetings between teams.
"I stopped consolidating Excels. I started managing the season's last mile."
— Operations Manager
Explore more use cases
One platform. Every retail decision.
Inventory, allocation, pricing, planning, execution — connected in a single operational layer.