IT/Data
Every KPI, defined once.

Aurélien

The retailer
A 12-store lifestyle retailer, three buyers, six thousand five hundred SKUs.
Our retailer operates 12 stores across France in the lifestyle apparel multi-canal mid-market segment. The team is structured: a 3-person buying team, a 1-person operations lead, and a 1-person merchandiser, running roughly 6,500 SKUs in season across stores and e-commerce.
The stack is mainstream for the sector — LCV Mag as core retail management, Shopify for e-commerce, and Excel as the connective tissue between everything else. It works. Until it doesn't.
"Three teams pulled sell-through three different ways. Every Monday, we debated which one was right."
— Operations Lead
Context
Twelve spreadsheets, one company, no shared language.
2024. The lifestyle retailer had grown from 6 to 12 stores in three years. Each new function — buying, finance, ops, store managers — had built its own KPI definitions in its own spreadsheet.
Sell-through meant three different things. Margin was calculated four different ways. Inventory cover varied by team. The numbers in the Monday meeting never matched, and 30 minutes were burned every week deciding which version to trust.
The data was correct. The definitions weren't.
The Problematic
Same KPI, twelve spreadsheets, twelve answers.
Every team had legitimate reasons for its definition. Buying calculated sell-through over the full season. Finance calculated it over the calendar quarter. Store managers calculated it over rolling 4 weeks. None of them was wrong — but none of them matched.
When the head of retail asked "how's our sell-through?", she got three different answers depending on who replied. Decisions were made on negotiated averages, not real numbers.
Three problems made it worse:
Same KPIs calculated differently across buying, finance, ops, and stores.
30 minutes per Monday meeting spent reconciling versions.
Decisions delayed until everyone agreed on the number.
The company didn't lack data. It lacked a shared definition of the data.
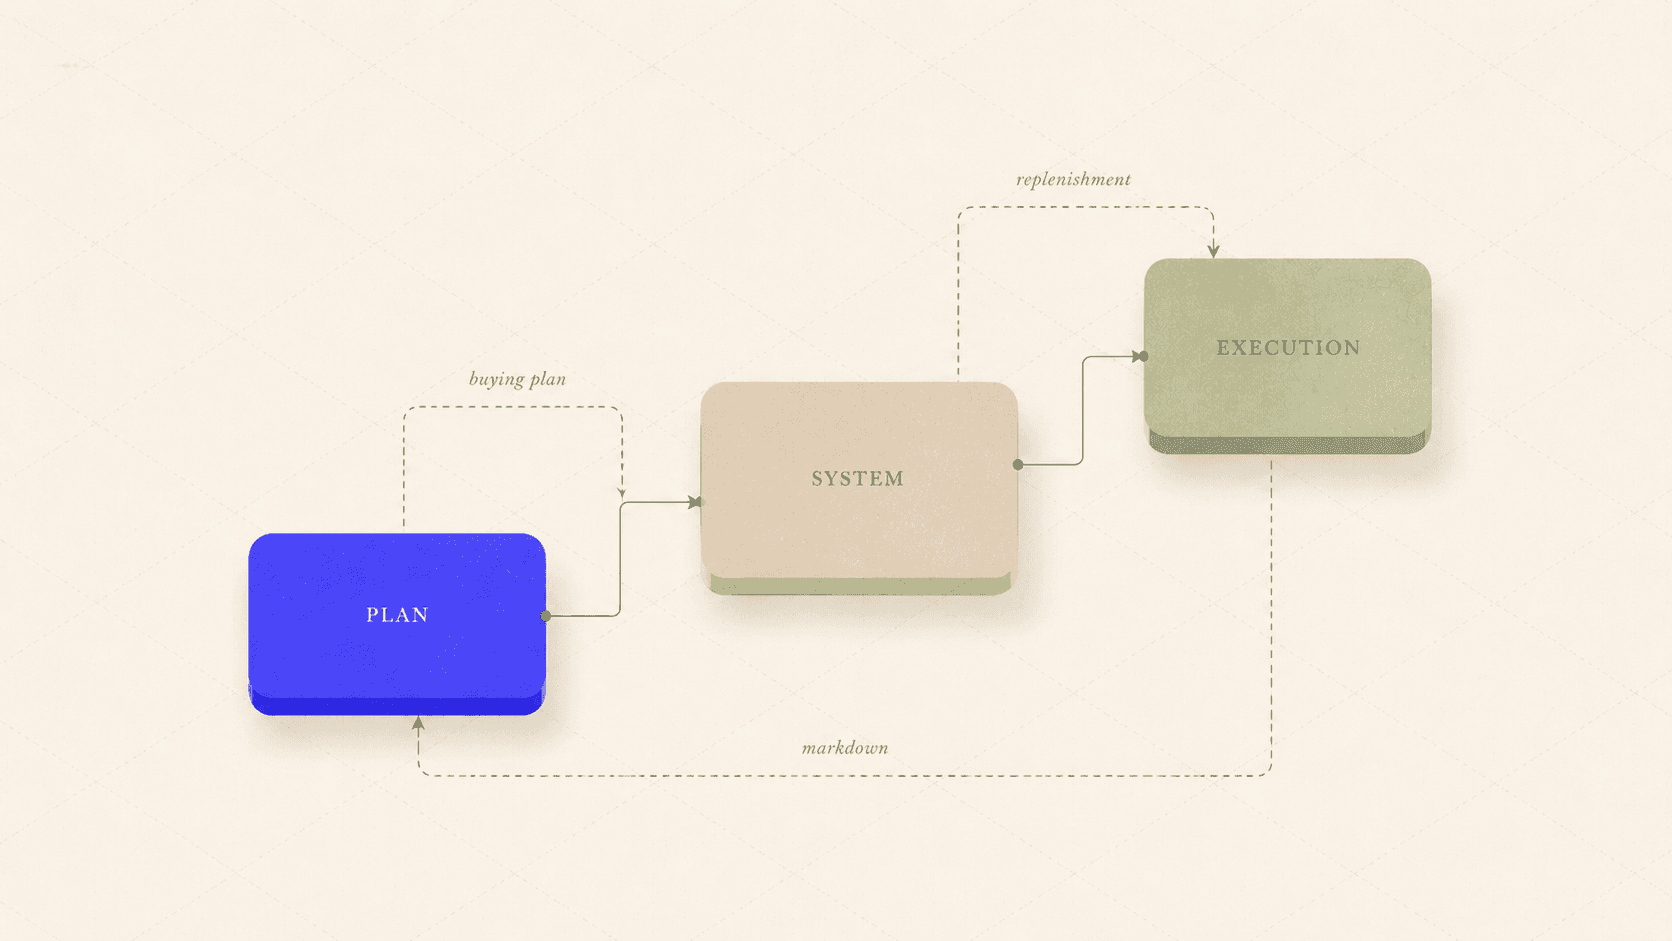
The Solution
Every KPI defined once, in Solya, used everywhere.
Solya's metrics layer became the single source of definition for every retail KPI. The team agreed on definitions once: sell-through, margin contribution, full-price share, stock cover, conversion. Each definition was encoded in the metrics factory, with the underlying logic visible to anyone.
From that point on, every dashboard, every report, every meeting drew from the same metrics layer. Disagreements about numbers stopped. Disagreements about strategy started — which is what they were supposed to be about all along.
One agreed definition per KPI, encoded once, visible to everyone.
Every dashboard reads from the same metrics layer.
Versioning preserved — every change logged with reason and date.
Definitions stopped being team-specific. They became company assets.
÷ SUM(units_received)
OVER full_season
How we did it
Inside the loop.
The metrics layer ran on the Intelligence Layer, with every team contributing to the definitions and consuming the same outputs. Here's how the system works, end to end.
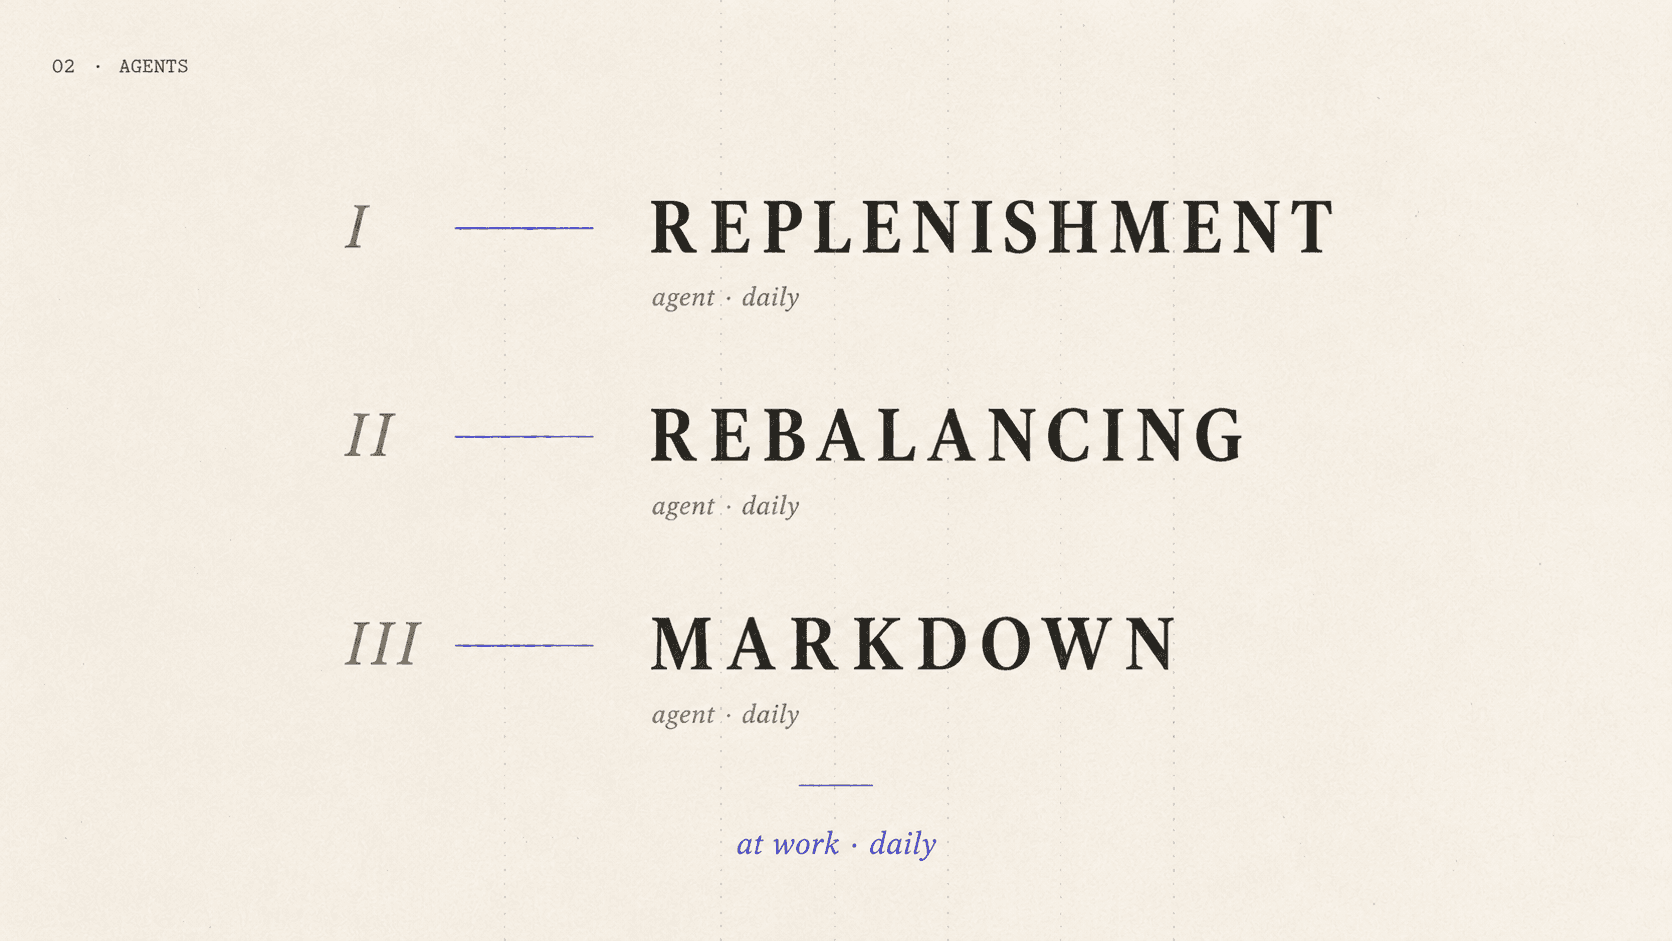
01 — Map every existing definition.
Solya inventoried every KPI used across the company — and every variation in its calculation. Twelve spreadsheets surfaced thirty-two distinct definitions.
02 — Agree on shared definitions.
The team ran three workshops to align: which definition to keep, which to retire, which to merge. Every decision was documented.
03 — Encode in the metrics factory.
Each agreed definition was encoded once in Solya, with the underlying SQL-like logic visible to anyone. Versioning preserved the history.
04 — Connect every dashboard.
Every team's dashboards, reports, and exports were rewired to read from the metrics layer. Buying, finance, ops, stores — all on the same plumbing.
05 — Govern over time.
When a team needed a new definition or a tweak, it went through the metrics factory. Solya logged every change, with reason and date.
Definitions stopped being team-specific. They became company assets.
The Impacts
One number, every team, every meeting.
After three months running on the shared metrics layer, the company's Monday meetings shifted from debating numbers to discussing what to do with them.
1 source — Of truth for every KPI.
12 → 1 — Spreadsheets consolidated.
Zero — Reconciliation time per meeting.
32 → 14 — Distinct KPI definitions across the company.
"We stopped fighting about numbers. We started fighting about strategy. That's a much better fight."
— Operations Lead
Explore more use cases
One platform. Every retail decision.
Inventory, allocation, pricing, planning, execution — connected in a single operational layer.