Markdown
Network performance, in real time.

Aurélien
The retailer
A 12-store lifestyle retailer, three buyers, six thousand five hundred SKUs.
Our retailer operates 12 stores across France in the lifestyle apparel multi-canal mid-market segment. The team is structured: a 3-person buying team, a 1-person operations lead, and a 1-person merchandiser, running roughly 6,500 SKUs in season across stores and e-commerce.
The stack is mainstream for the sector — LCV Mag as core retail management, Shopify for e-commerce, and Excel as the connective tissue between everything else. It works. Until it doesn't.
"I used to discover store problems three weeks late, in a monthly report. The damage was always done."
— Head of Retail
Context
A 12-store network managed on monthly reports.
2024. The head of retail had inherited a reporting cadence from the company's smaller days: monthly store reviews, with a 3-week analysis lag. Sell-through, margin, stockouts, conversion — all aggregated, all retrospective.
When one store's traffic dropped or another started underperforming on a key category, the head of retail learned about it three to four weeks after the fact. By then, the season had moved on, and the lever to act had often closed.
She had the reports. She just didn't have the time.
The Problematic
By the time the report landed, the action window had closed.
Monthly reports were built by a finance analyst, with three weeks of preparation. They covered every store on every dimension — and arrived at the head of retail's desk too late to be operational.
Drifting stores stayed drifting until someone noticed in the next monthly cycle. Stockouts on key categories were dealt with reactively, not preventively. The head of retail spent her weeks managing on intuition and store visits, not on data.
Three compounding gaps:
Store performance reported monthly when stores moved daily.
No alert when a store's KPI started drifting from its tier benchmark.
Decisions made on three-week-old aggregated data, not live signals.
The head of retail was running a 12-store network on yesterday's news.
The Solution
One live dashboard for the head of retail.
Solya consolidates POS, e-com, and stock data from LCV Mag in real time. The head of retail opens her dashboard every morning and sees: every store's sell-through, margin, conversion, and stockout status, against its expected benchmark.
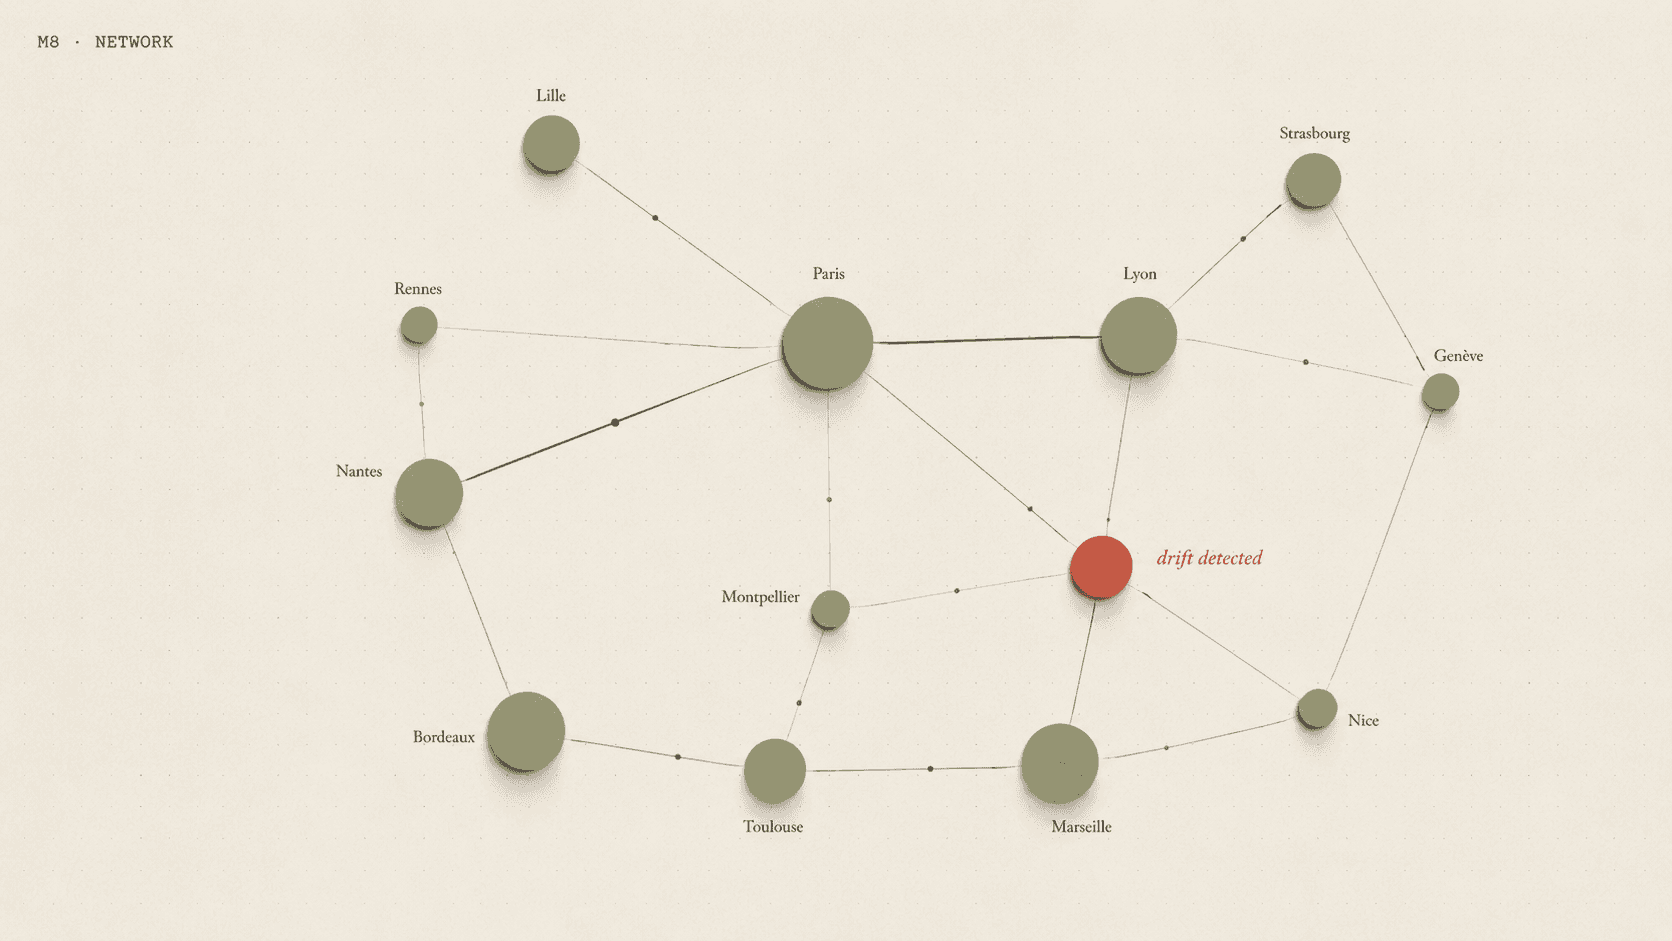
When a store starts drifting — sell-through 5 points below tier benchmark, margin compressing, conversion dropping — Solya flags it. The head of retail acts in days, not weeks. Store managers receive precise feedback, not generic monthly recap.
12 stores live on one grid, color-coded by drift severity.
Tier-aware benchmarks — each store evaluated against its peers, not network average.
Drilldown on any cell — underlying data, recommended action, historical context.
The network started behaving like a network.
How we did it
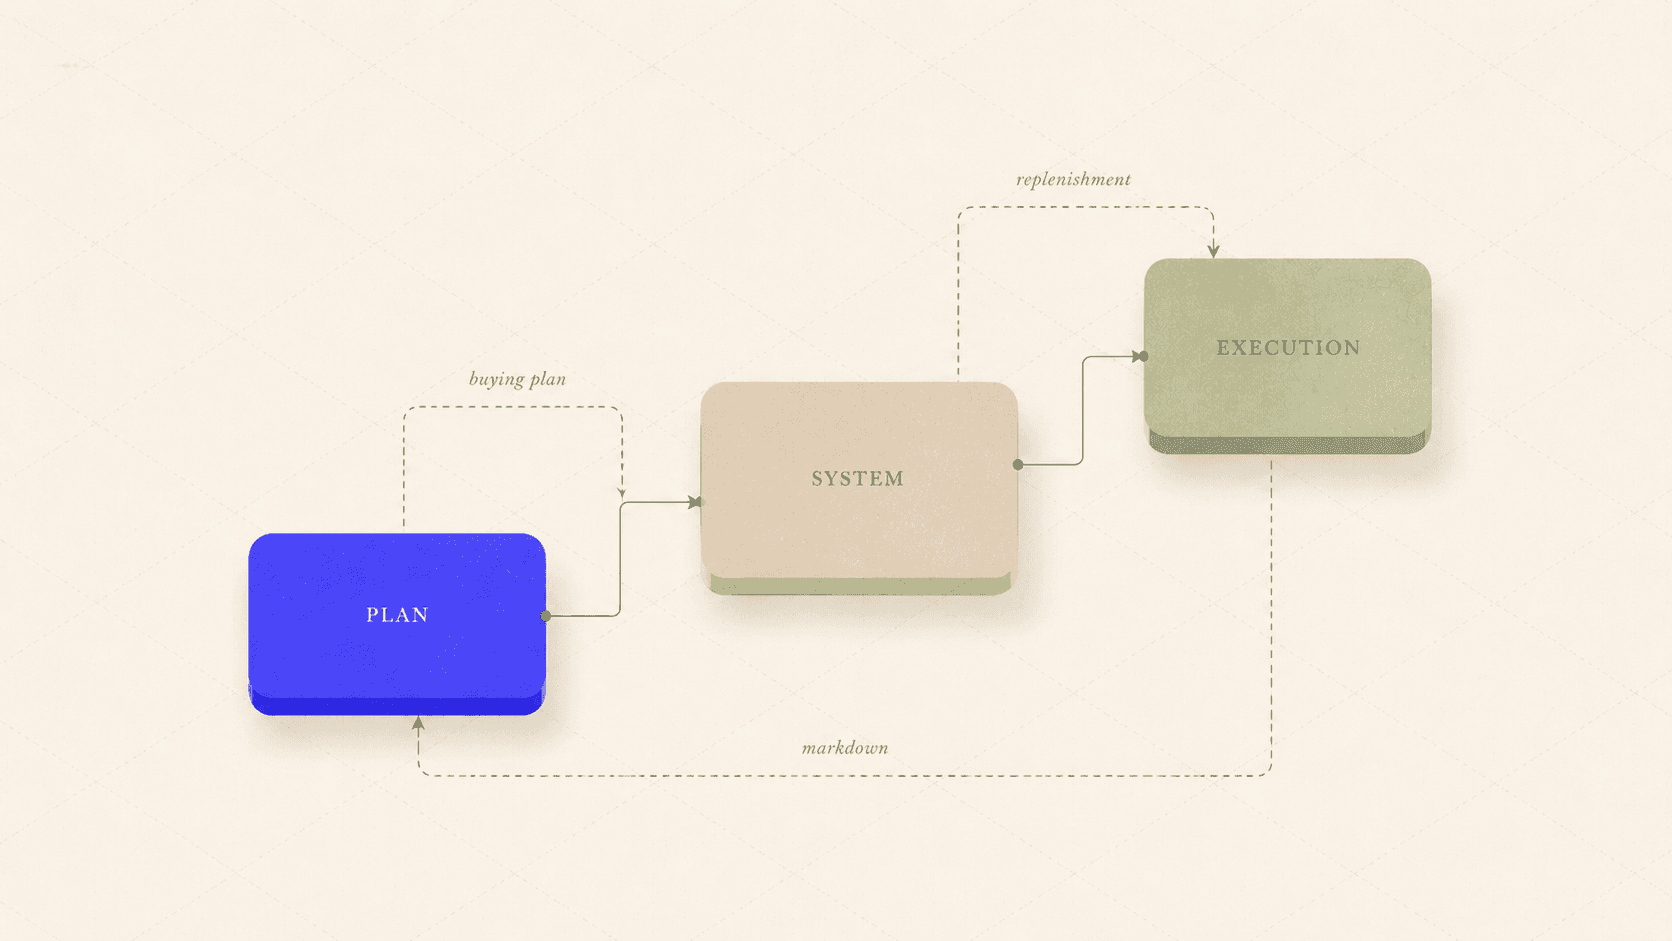
Inside the loop.
The network dashboard runs continuously. The head of retail acts on signals, not reports. Here's how the system works, end to end.
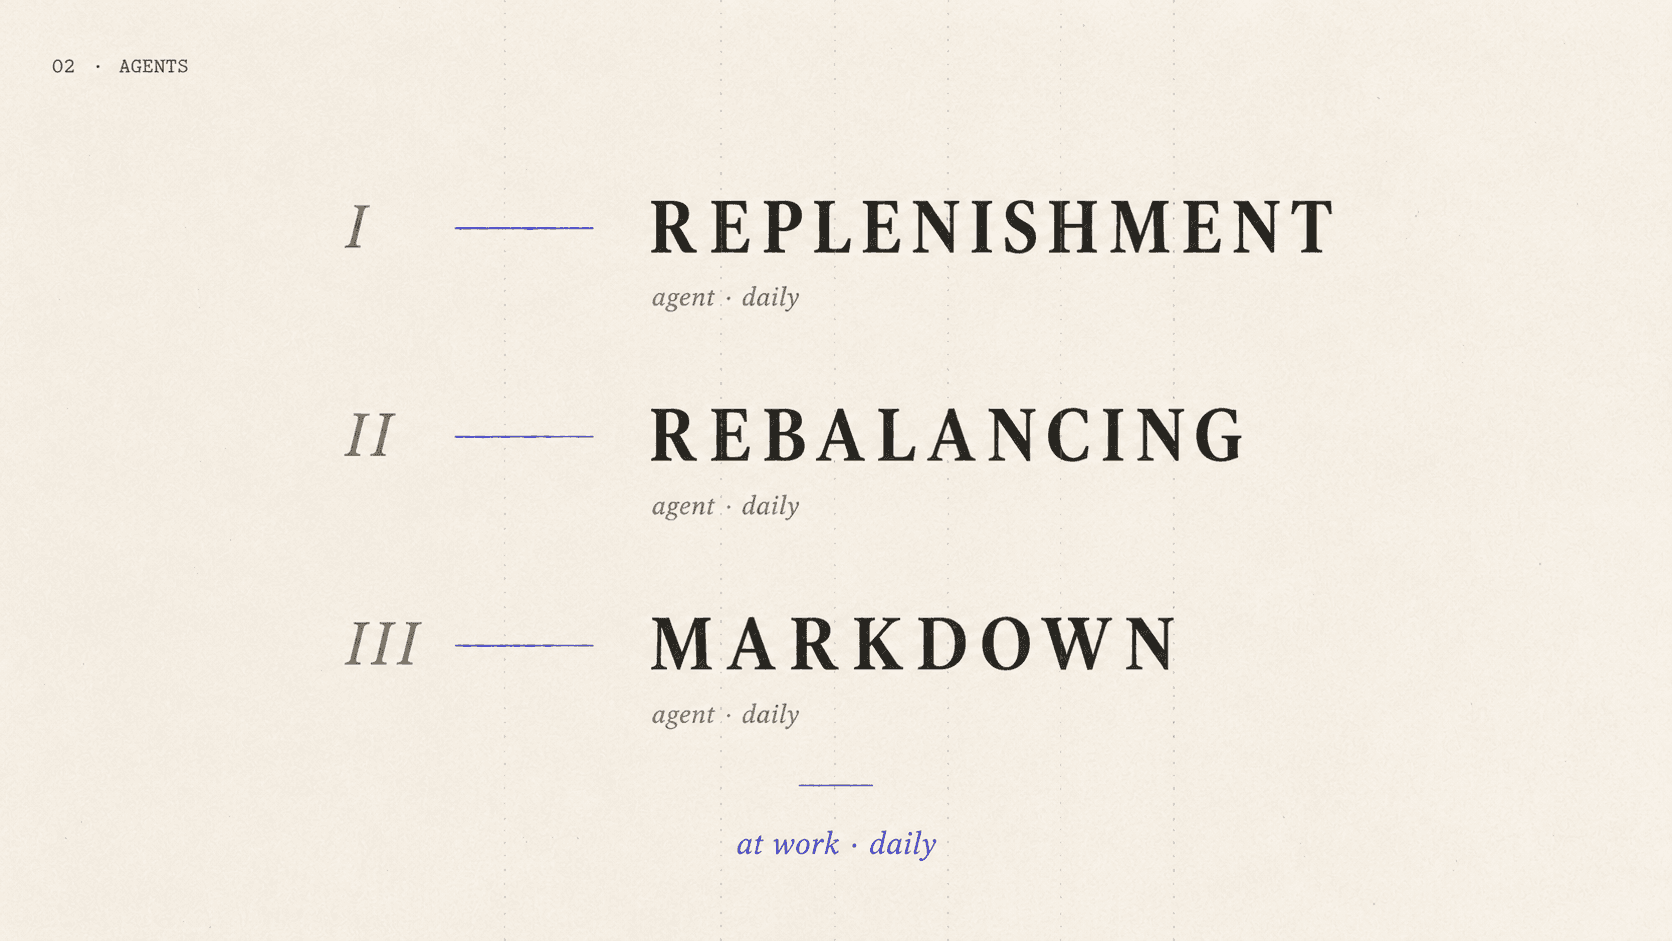
01 — Pull store data live.
Solya ingests sales, stock, conversion, and margin data from LCV Mag for every store, every channel, every minute.
02 — Tag every store on its tier.
Each store has a benchmark profile: tier, customer mix, category strength, seasonal pattern. KPIs are evaluated against the right benchmark, not the network average.
03 — Compute drift signals.
When a store's KPI moves outside its expected band, Solya raises a signal. Confidence levels and historical context are attached.
04 — Surface in one dashboard.
The head of retail sees a live grid: 12 stores, 5 KPIs, color-coded by drift severity. Drilling into any store shows the underlying data and the recommended action.
05 — Close the loop with stores.
Store managers receive precise, contextual feedback. Solya tracks corrective actions and their impact, learning what works in each store.
Monthly reports kept being produced. They just stopped being where decisions happened.
The Impacts
A network that runs on signals, not reports.
After six months running on the live network dashboard, the head of retail stopped waiting for monthly cycles and started acting on weekly signals.
Monthly → Live — Network performance cadence.
+11 pts — Reaction speed on drifting stores.
1 dashboard — For the head of retail and store managers.
Days, not weeks — From signal to corrective action.
"I went from running on monthly retrospectives to managing live. That changed everything."
— Head of Retail
Explore more use cases
One platform. Every retail decision.
Inventory, allocation, pricing, planning, execution — connected in a single operational layer.